
Why black-box account scoring kills your pipeline
(and what to do about it)

Sales leaders face the same territory planning problem every year: how do you divide up accounts fairly while making sure every rep can actually hit their number?
Most teams fall into two camps. They either use black-box scoring tools or build one-time scores using manual spreadsheets that become outdated the moment the market changes.
At Clay, we’ve built an always-on territory planning system that solves both problems. We use Clay to continuously score accounts based on fit and engagement, fairly distribute good-fit target accounts, and surface buying signals in real-time so reps know where to focus.
The result is territories that stay balanced when markets shift, scoring that’s clear enough for reps to trust, and automatic workflows that flag hot accounts before your competitors notice them.
Here’s how we built it and how your team can do the same.
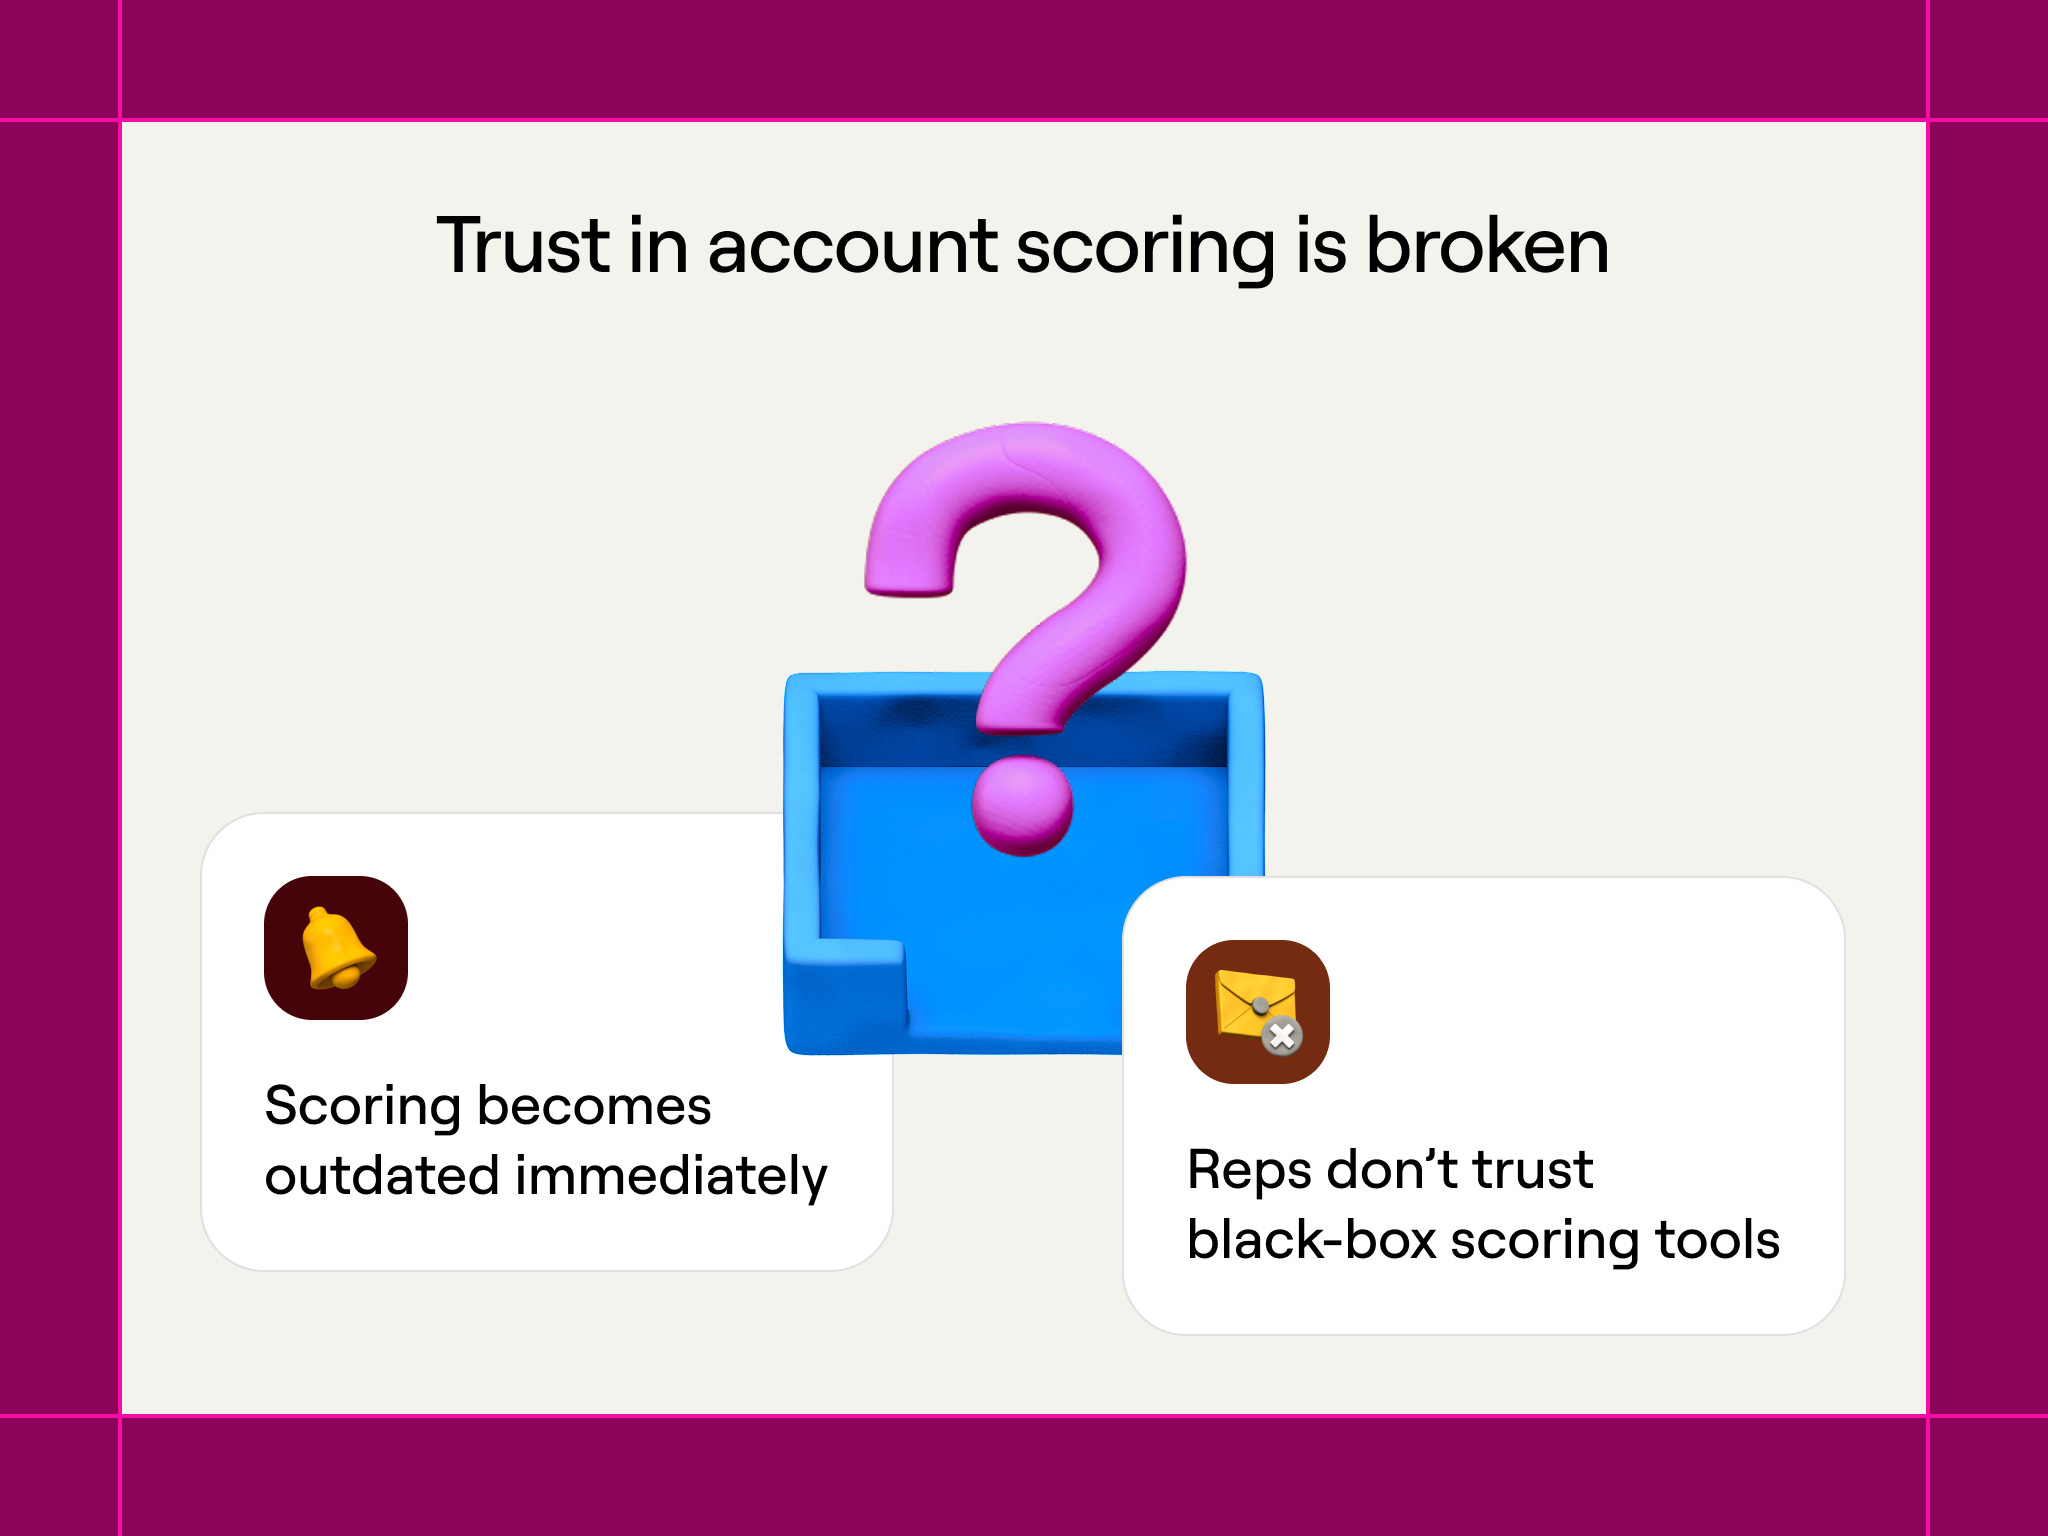
The problem: Trust in account scoring is broken
There are two big issues in territory planning that most sales teams will find familiar.
1. Scoring becomes outdated immediately
Traditional territory planning happens once a year, as sales ops teams pull firmographic data, apply some basic filters like company size and industry, then divide accounts into territories.
The problem is that the second planning wraps up, reality starts drifting from the plan. A company might raise a Series B and suddenly have a budget. Another company might hire a new CRO who wants to rebuild their stack. A third may start viewing your pricing page constantly.
Tracking account scores manually would require watching dozens of data points per account. For a team managing 10,000 accounts with 20 signals each, that’s 200,000 data points to monitor. No one has time for that.
2. Reps didn’t trust black-box scoring tools
Many tools promise automated scoring, as well as ABM campaigns on autopilot to sellers and marketers. They’re simply asked to trust a process they have very little insight into. The black-box platforms update on their own, but they create a different problem: nobody understands how accounts get scored.
A rep looks at their territory and sees Account A scored 95 and Account B scored 60. When they ask why, the answer is “proprietary algorithm” or “our machine learning model.” The rep can’t explain to their manager why they’re focusing on certain accounts. More importantly, they can’t use the score to write better messages, because they don’t know which signals created that number.
This lack of clarity kills trust. When quota is on the line, reps want to understand exactly why the system tells them to focus on specific accounts. If they can’t see the data, they ignore the scores and trust their gut.
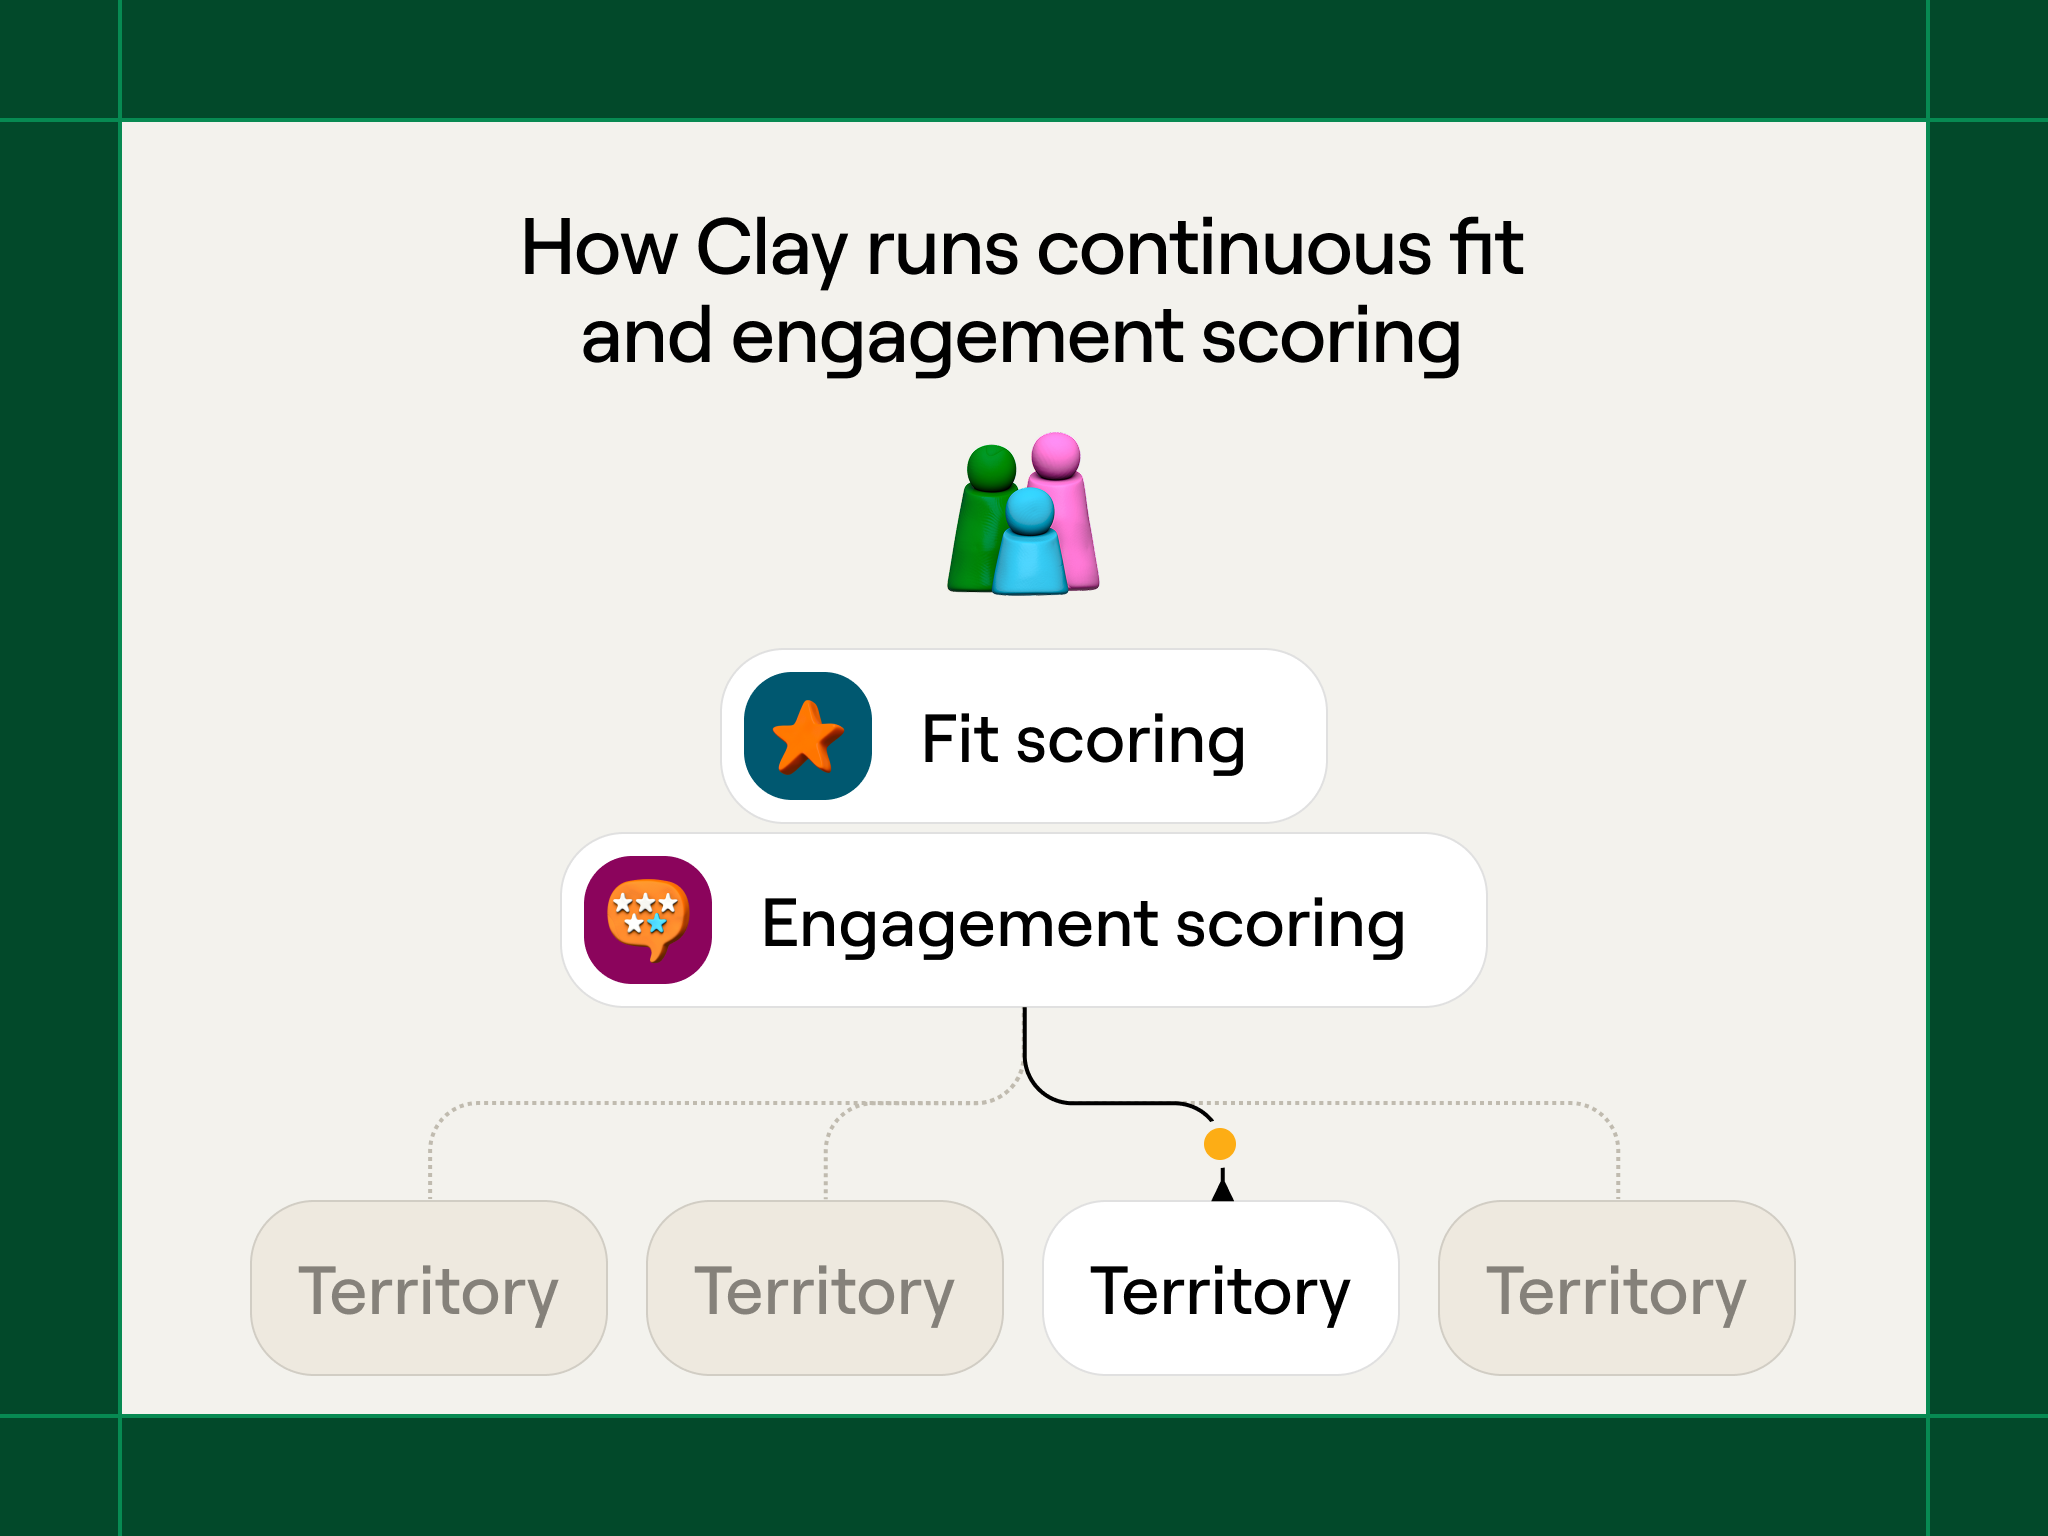
How Clay runs continuous fit and engagement scoring
Clay solves these problems by continuously scoring accounts using custom signals and automatically shifting accounts around as things change. Clay is also able to map enterprise company hierarchies automatically so there aren’t any fights over territories.
Fit scoring based on custom AI signals
Fit scoring decides which companies should be in territories. We only put accounts in territories when they hit a minimum fit threshold (for us, a score of 65 out of 100).
We’re moving towards assigning territories based on company headquarters location and segment, but fit scoring still matters for two reasons: it determines which accounts meet the minimum bar for assignment, and it helps reps prioritize within their territory. A rep might have 200 accounts in their geographic region, but only the 150 that score 65+ actually get assigned to them. The rest stay with marketing until they improve.
Traditional fit scoring uses standard firmographic data, like employee count, industry category, revenue range. These signals matter, but they’re basic information that every competitor can access.
Your real edge, or GTM alpha, comes from signals that standard enrichment providers don’t offer. For example, here are some of the questions about companies that we use as signals:
How they go to market: Is the company product-led, sales-led, or hybrid? We use Claygent to check their website and figure out their approach, because this tells us how they’ll evaluate and buy new tools like ours.
Whether they’re AI-native: Does this company position itself as AI-first? We look for AI-related messaging on their site, AI engineering job postings, and AI mentions in their product descriptions. AI-native companies often buy differently and budget differently than traditional software companies.
Who they’re hiring: Are they hiring GTM engineers? Expanding their SDR team? These job postings show both budget availability and specific problems we can help solve.What tools they use: Which tools do they currently run? We look at not just their CRM and marketing automation, but their data warehouse, BI tools, and enrichment providers. This shows us their technical setup and whether they have infrastructure that works with Clay.
Funding and growth patterns: Recent fundraising, headcount growth, and expansion signals point to companies with budget and momentum—good timing for adopting new tools.
Job descriptions: Are new job types and descriptions showing up on a company’s career page? That signal actually indicates more than just roles the company is hiring for because the descriptions also give you technographic data.
Standard enrichment tools can’t answer questions like “Is this company AI-native?” or “Do they use product-led growth?” No database has those answers. Clay lets us define these signals ourselves through web scraping, Claygent analysis, and custom formulas.
Engagement scoring based on recent activity
Fit scoring determines which accounts a rep should care about (highest ACV). Engagement scoring gives them an indication of warmth and likelihood of closing. It also tells marketing which high fit accounts need awareness marketing to warm them up as potential leads.
A rep or SDR can’t prospect into 200 high-fit accounts at once. They need to know which ones are showing buying signals right now.
We combine the following signals into an engagement score of a single, constantly updated, number:
Website visits: Which pages are they checking out? How often? Pricing page views and feature comparison pages show higher intent than blog traffic.
Social activity: Are they engaging with our content on LinkedIn? Commenting on posts about problems Clay solves? Following our company page? These are the sorts of signals that give us an idea of a prospect’s familiarity or engagement with Clay.
Champions changing jobs: Did a staunch advocate just take a new role? That’s a strong signal to reach out and see how you can help them at their new company.
Project descriptions: Did a target company just announce a new project? Did a relevant project pop up in a job description? That signal can change engagement potential.
Product usage: For existing customers, are they expanding workspace usage? Creating new tables? These signals suggest they’re happy and might expand.
Event attendance: Did they join our webinar? Download a guide? Register for an event? These actions show active research.
Unlike fit score (which changes slowly as company basics shift), engagement score reflects current buying behavior and can jump fast when accounts heat up.
How engagement scores direct sales and marketing behavior
On day one of the year, a rep logs into Salesforce and sees 200 accounts in their territory. Instead of randomly picking where to start, they filter for accounts with engagement scores above 90.
This might surface 15 accounts showing strong signals right now. The rep can click into each account and see exactly why it scored 90+: they hired a new CRO last month, they’ve checked the pricing page three times this week, and they attended last Thursday’s webinar.
This clarity matters. The rep isn’t just following a mysterious algorithm. They understand the specific signals creating the score and can mention them in outreach. “I noticed you recently hired a RevOps lead and your team has been researching data enrichment” works way better than “You’re scored as high-intent.”
Potential contract value scoring
Another dimension we look at is estimating how much an account might spend. Two accounts might have identical fit and engagement scores, but one could be worth 10x the revenue of the other.
We estimate potential contract value (ACV) by looking at:
Historical deal patterns: How much have similar companies spent with us? If we’ve closed five deals with 200-person fintech companies and they all landed between $40K-$60K, that gives us a baseline for new fintech prospects of similar size.
Usage indicators: For product-led companies, we can see product usage patterns before they become paying customers. High workspace creation, frequent table usage, and power-user behaviors signal higher potential spend.
Technographic complexity: Companies with sophisticated data stacks (warehouses, BI tools, multiple data sources) typically need more advanced Clay capabilities and spend more than companies with basic setups.
Team size in relevant functions: A company with 50 GTM team members will likely spend more on Clay than one with 5, simply because more people need access and they’ll run higher-volume workflows.
Industry and business model: B2B SaaS companies with large sales teams typically have different spending patterns than B2C companies or services businesses, even at similar headcount.
We don’t try to predict exact ACV down to the dollar. Instead, we bucket accounts into ranges: $10K-$25K, $25K-$50K, $50K-$100K, $100K+. This is precise enough to inform prioritization without getting lost in false precision.
Why potential value matters for prioritization
Two accounts might both be Tier 1 (high fit, high engagement), but if one has a potential ACV of $100K and another has $15K, reps should focus more energy on the higher-value opportunity. This doesn’t mean ignoring smaller deals—it means calibrating effort to potential return.
Potential value also helps with territory balancing. A territory with 150 accounts averaging $40K potential ACV is roughly equivalent to a territory with 200 accounts averaging $30K potential ACV, even though the account counts differ.
How Clay triggers automatic workflows based on score changes
The real power comes from tying scoring to automatic actions. When an account crosses a key threshold, Clay triggers the right workflow instantly:
New high-fit accounts get assigned automatically: If a company raises a Series B and its fit score crosses 65, Clay assigns it to the correct territory based on geography and balance. The rep doesn’t have to hunt for it — the account simply appears in their Salesforce view.
High-engagement alerts go straight to reps: When an account’s engagement score passes 90, the assigned rep gets a real-time Slack alert showing exactly which signals caused the spike. No waiting for weekly reports that might miss the moment.
Quarterly territory rebalancing runs on its own: Every quarter, we refresh fit scores across all accounts. If market conditions shift — industries heat up, ideal-customer patterns change — Clay automatically rebalances territories to keep them fair. No more year-long drift from the original plan.
How we tier accounts and set quarterly targets
Scoring every account is one thing. Deciding which accounts get active attention is another.
We use fit, engagement, and potential contract value together to create a three-tier system that determines how reps and marketing allocate their time:
Tier 1: High fit (65+), high engagement (75+), strong potential value ($50K+ ACV)
These are accounts showing strong product fit, active buying signals, and meaningful revenue potential. Reps should be working these accounts now—personalized outreach, custom demos, executive engagement. These accounts get weekly touchpoints and immediate follow-up on any engagement spike.
At the start of each quarter, we set explicit targets: “Each rep should have 15-20 Tier 1 accounts they’re actively working.” This number varies based on average deal size and sales cycle length, but the principle holds: Tier 1 accounts deserve concentrated, high-touch attention.
Tier 2: High fit (65+), moderate engagement (40-74) or moderate potential value ($25K-$50K ACV)
These accounts belong in your territory and could become opportunities, but they’re either not showing strong buying signals yet or represent smaller deals. Reps touch these accounts monthly through campaigns, relevant content sharing, and lighter-touch outreach. The goal is moving high-potential accounts into Tier 1 through engagement.
Marketing runs targeted campaigns to these accounts—relevant case studies, webinar invites, educational content about problems they likely face. When engagement jumps on high-value accounts, they automatically move to Tier 1 and get flagged for rep follow-up.
Tier 3: High fit (65+), low engagement (0-39), lower potential value (<$25K ACV)
These accounts meet your ICP but aren’t engaging yet or represent smaller opportunities. They stay in territories for visibility, but reps don’t actively work them. Marketing owns these accounts through broader campaigns and brand building. If engagement climbs or if potential value increases (company grows, expands team, etc.), they move up tiers automatically.
Accounts below 65 fit score don’t get assigned to territories at all. They stay in a general pool for broad marketing programs until their fit score improves.
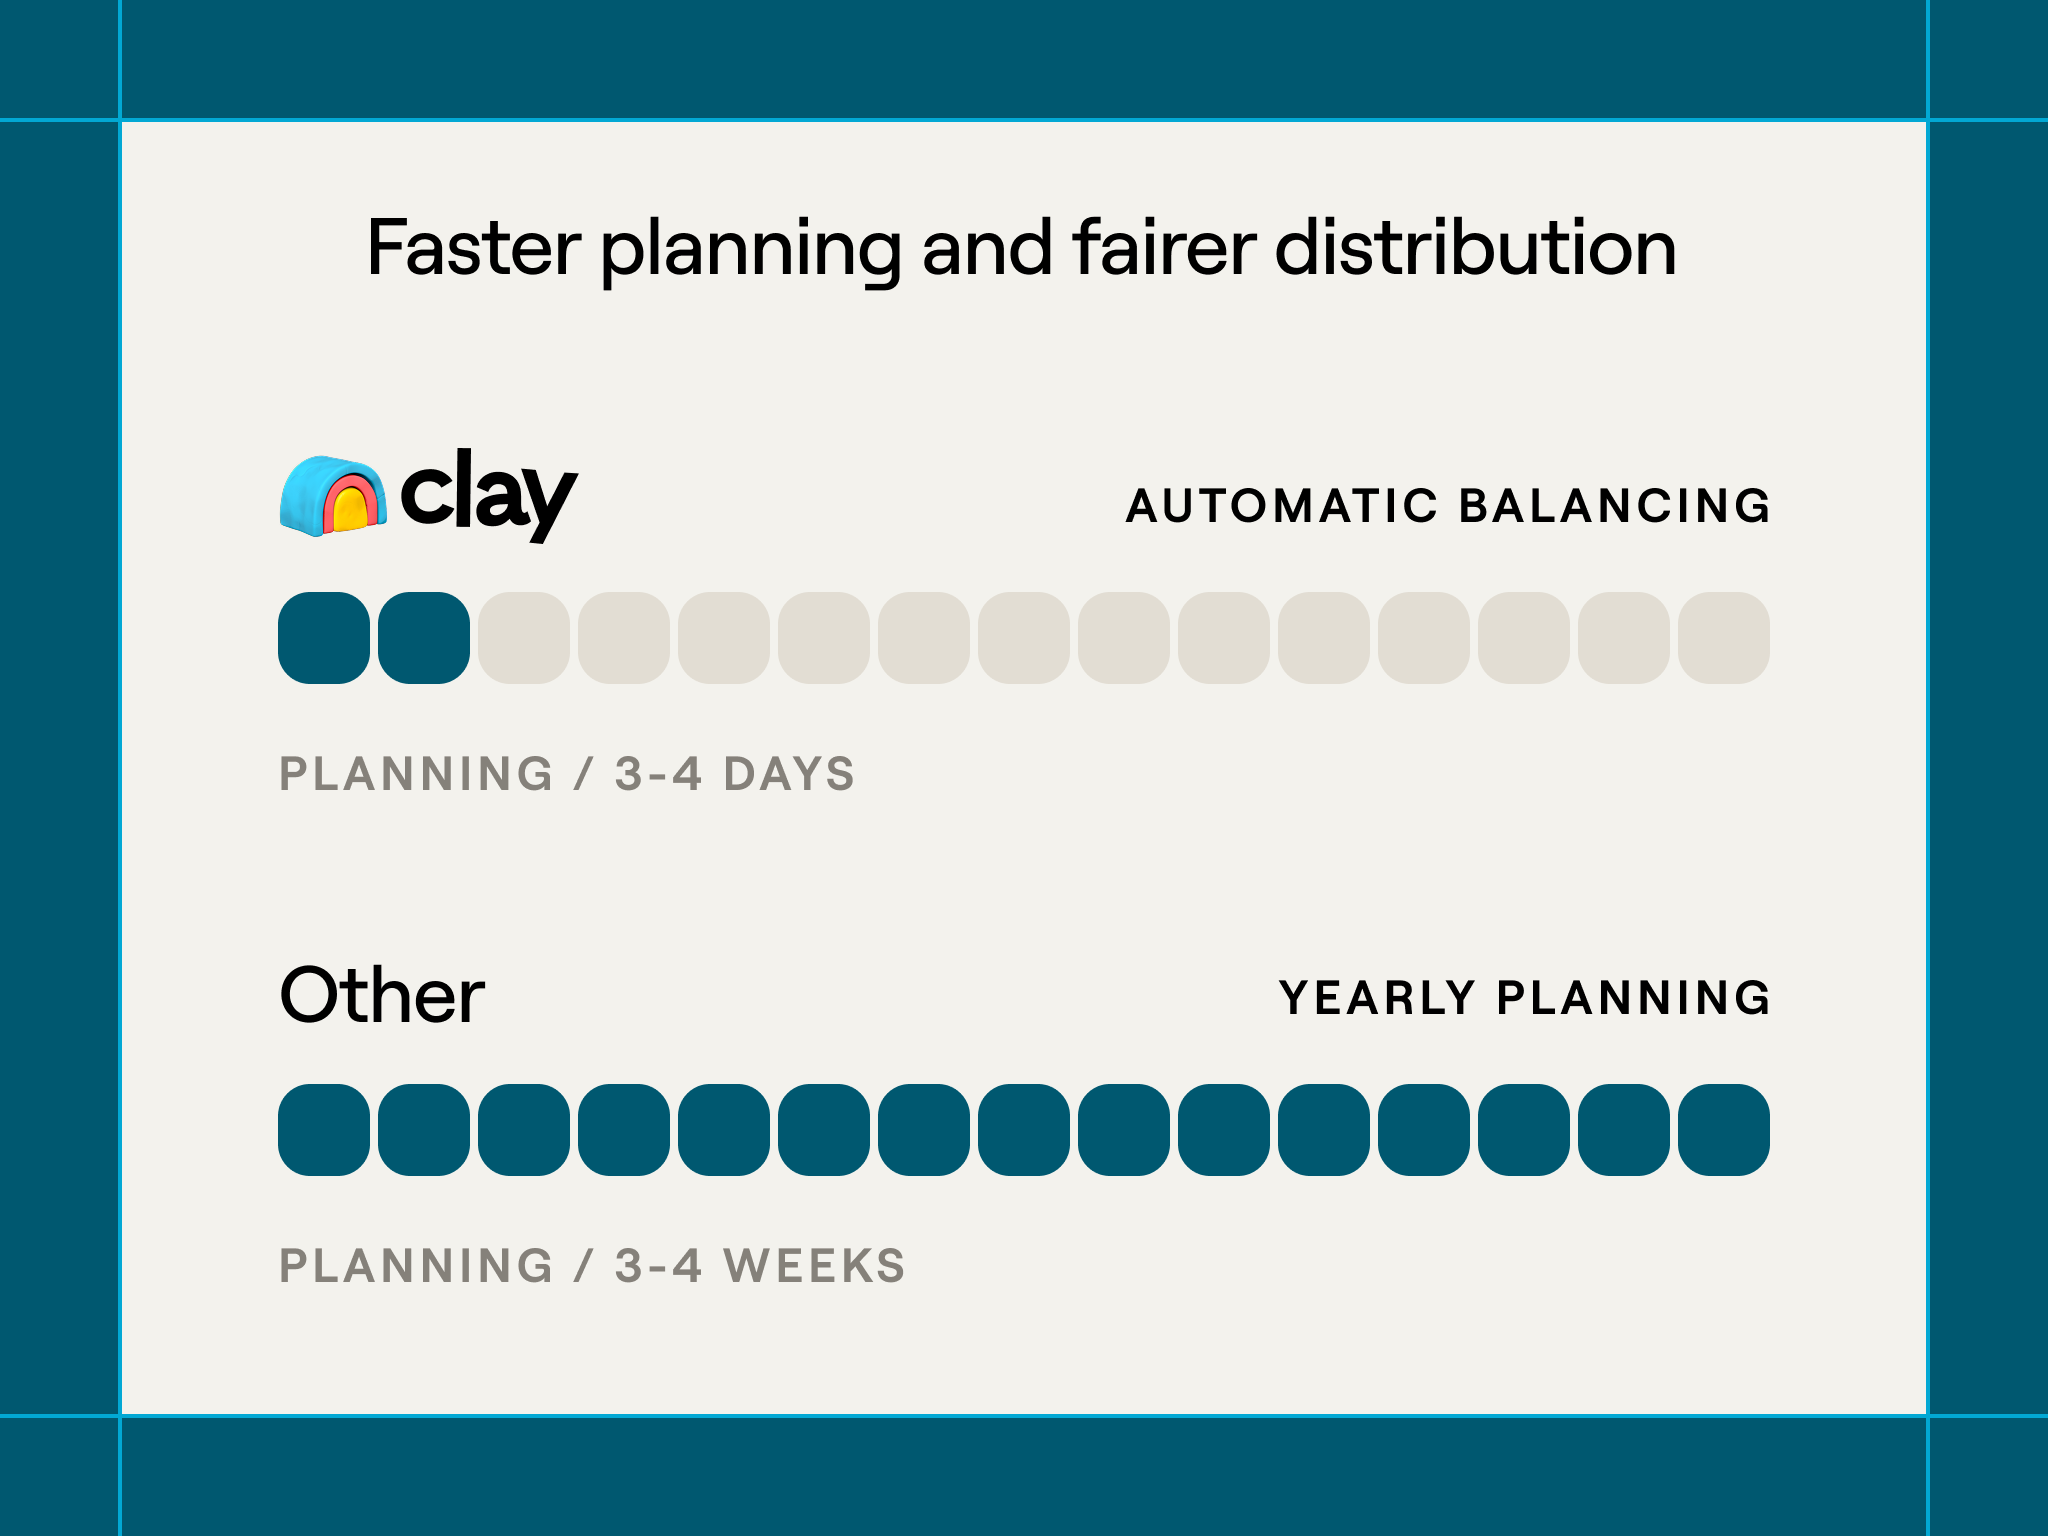
Real impact: faster planning and fairer distribution
This system has completely changed how we approach territory planning at Clay.
Planning cycles go from weeks to days
Previous territory planning took 3-4 weeks every year. Sales ops pulled data from multiple sources, manually analyzed account quality, debated fairness, and finally handed out assignments. By the time territories were finalized, market conditions had already shifted.
Now territory planning takes 3-4 days. Fit scores are already calculated and current. Account balancing happens automatically based on scoring metrics. Sales leadership can review proposed territories, make strategic adjustments, and ship assignments while the data is still fresh.
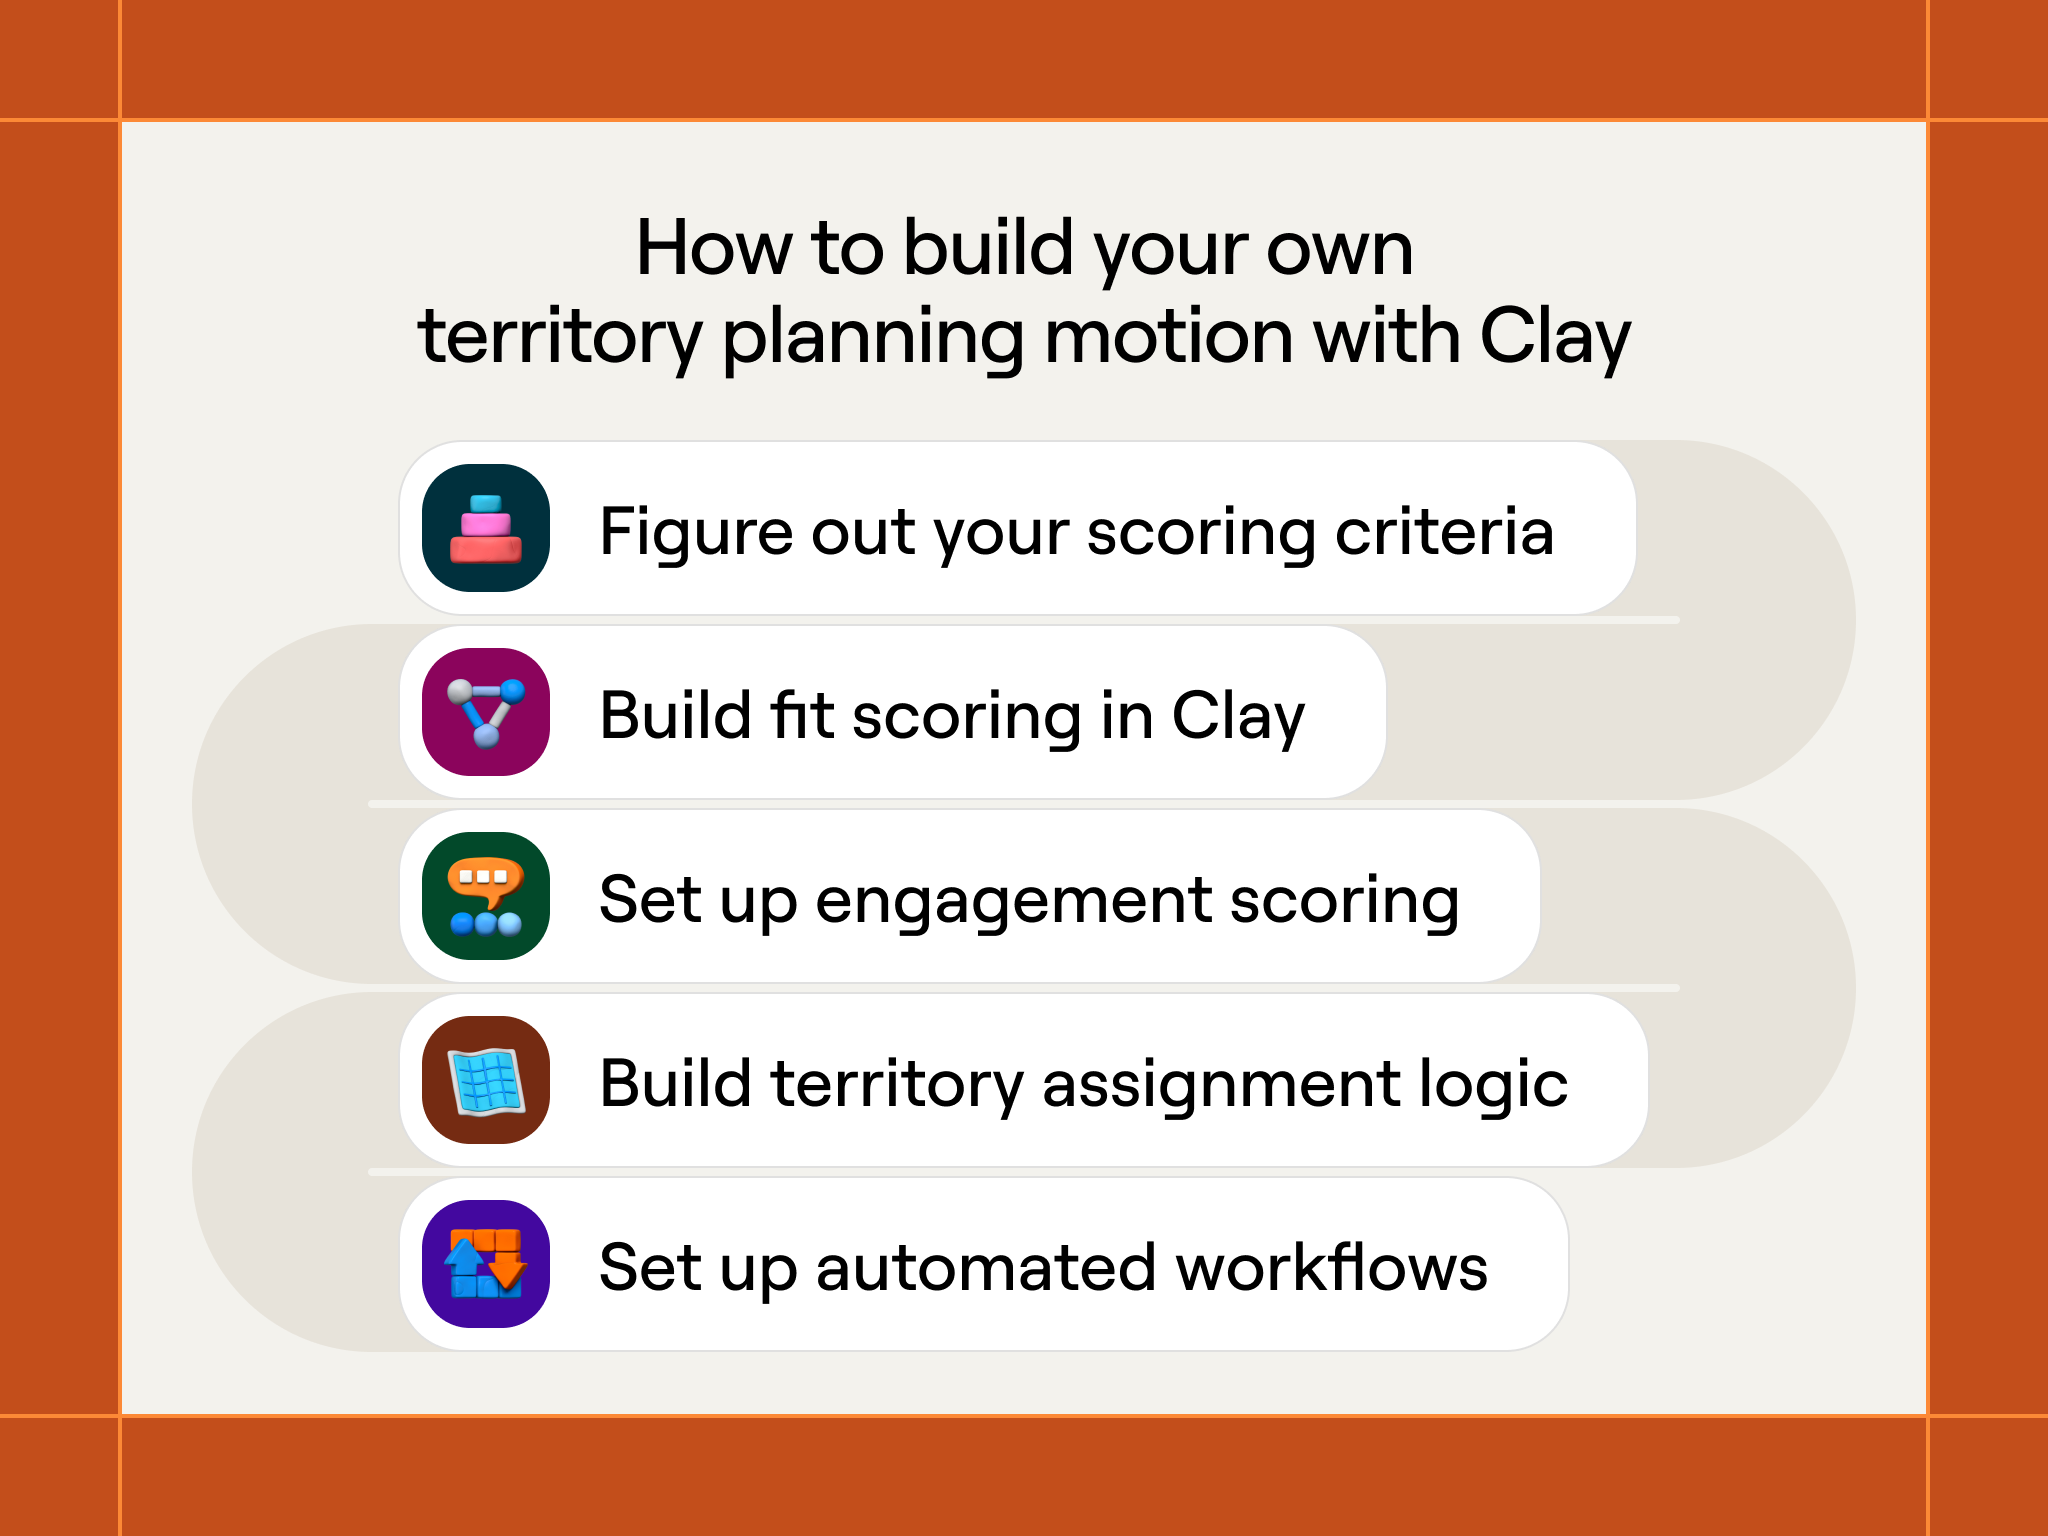
How to build your own territory planning motion
Creating this system means connecting your data sources, defining your scoring, and setting up workflows that keep territories current over time.
Phase 1: Figure out your scoring criteria
Start by determining which signals actually predict success in your sales process. Don’t guess; look at your existing customers.
Pull your best customers from the past year. Export their data and enrich it in Clay using every signal you think might matter: company size, growth rate, tech stack, how they go to market, hiring patterns, industry, and any custom signals specific to your product.
Look for patterns. Do your best customers share similar traits? Are they all product-led companies? Do they all have data warehouses? Do they all hire for specific roles?
Create your initial fit scoring based on these patterns. Weight signals by how strongly they connect with customer success. If 80% of your best customers are PLG companies, give that high weight in your score. If their tech stack doesn’t matter much, weight it lower.
Example initial scoring weights:
How they go to market (PLG vs sales-led): 20 points
Company size (50-500 employees): 15 points
Tech stack sophistication (has data warehouse): 15 points
Growth trajectory (headcount growing >20% per year): 15 points
Hiring for relevant roles (RevOps, GTM engineering): 15 points
Industry fit (SaaS, professional services): 10 points
Funding status (Series A+): 10 points
Total possible: 100 points. Minimum threshold for territory assignment: 65 points.
This scoring isn’t set in stone. You’ll improve it based on results. But start with something grounded in your actual customer data.
Phase 2: Build fit scoring in Clay
Create a Clay table that pulls all accounts from your CRM and enriches them with the signals you defined in Phase 1.
How to set this up:
Import existing accounts: Connect your CRM to Clay and pull all company records you want to score
Enrich firmographic data: Use Clay’s data providers to add employee count, revenue estimates, industry classifications, and growth metrics
Enrich technographic data: Pull tech stack information to understand what tools they currently use
Analyze how they go to market: Use Claygent to visit company websites and classify whether they’re PLG, sales-led, or hybrid based on signup flows, pricing page structure, and product positioning
Pull hiring signals: Use job board integrations to spot relevant job postings (RevOps roles, SDR positions, data engineering hires)
Calculate fit scores: Use Clay’s formula columns to apply your scoring weights to each signal and create a total fit score (0-100)
Write scores back to CRM: Push the fit score back to your CRM so it’s available for territory assignment and rep visibility
Set this table to refresh weekly so scores stay current as company data changes.
Phase 3: Set up engagement scoring
Engagement scoring needs more dynamic data sources that track current behavior rather than static company traits.
Data sources to connect:
Website analytics: Connect your website analytics (Google Analytics, Segment, etc.) to track which accounts visit your site and which pages they view
Social engagement: Track LinkedIn engagement with your company content
Product usage: For existing customers, pull workspace creation, table usage, and feature adoption metrics
Email and event engagement: Connect your marketing automation platform to track email opens, webinar attendance, and content downloads
Job change data: Monitor when target accounts hire for relevant roles or when key contacts change jobs
Build a Clay table that pulls these signals for each account and calculates an engagement score. Unlike fit scoring (which is relatively static), engagement scoring should update daily to catch buying signals while they’re hot.
The engagement score formula is simpler than fit scoring because you’re measuring recent activity rather than company basics:
Example engagement scoring:
Website activity (weighted by page value): 0-30 points
Social engagement: 0-20 points
Product usage trends (for customers): 0-20 points
Recent hires in relevant roles: 0-15 points
Event/content engagement: 0-15 points
Total possible: 100 points.
Push engagement scores back to your CRM alongside fit scores so reps see both numbers when reviewing accounts.
Phase 4: Build territory assignment logic
With scoring in place, you can now build the logic that puts accounts in territories.
Territory assignment rules we use:
Minimum fit threshold: Only accounts scoring 65+ on fit get assigned to territories. Everything below that threshold stays in a general pool for marketing to nurture.
Geographic distribution: Accounts get assigned to territories based on company headquarters location, unless there’s a specific reason to override (existing relationship, strategic account, etc.)
Account load balancing: We aim for roughly equal account counts per territory, adjusted for account quality. A territory with 180 accounts averaging 80 fit score equals a territory with 200 accounts averaging 72 fit score.
Hierarchy respect: When assigning a parent account to a territory, all subsidiaries automatically go to the same rep to prevent conflicts.
Strategic account exceptions: Executive leadership can manually override assignments for strategic accounts, but this should be rare.
Build these rules into a Clay table that processes your scored accounts and outputs territory assignments. Push these assignments back to your CRM so they’re visible to reps and sales leadership.
Phase 5: Set up automated workflows
The final step is connecting your scoring to workflows that automatically surface opportunities and keep territories balanced over time.
Critical workflows to build:
New high-fit account alerts: When a company’s fit score crosses 65 (meeting your minimum threshold), automatically assign it to a territory and notify the rep via Slack. Include key details: why the score increased, relevant company information, and suggested first actions.
Engagement spike notifications: When an account’s engagement score jumps significantly (20+ points in a week, or crosses 90), alert the assigned rep immediately with specific signals: “ABC Corp’s engagement score jumped to 93 because: 3 pricing page visits this week, new RevOps VP hired, attended Thursday’s webinar.”
Weekly territory digests: Every Monday, send each rep a ranked list of their top 10 highest-engagement accounts with action recommendations. This focuses rep attention on accounts most likely to convert this week.
Quarterly territory rebalancing: Every quarter, re-calculate fit scores for all accounts and check territory balance. If territories have drifted apart (one territory now has significantly higher average fit than another), flag this for sales leadership to review and rebalance.
Reps trust their territories because scoring is transparent
The biggest change is rep buy-in. When we used black-box scoring tools, reps regularly questioned why certain accounts were in their territory or complained about unfair distribution.
With transparent scoring, reps can see exactly why accounts scored the way they did. When they ask “Why is this account in my territory?” we can point to specific signals: they’re PLG, they’re hiring for RevOps, they have a data warehouse, they recently raised Series B. The rep understands the logic and trusts the assignment.
This transparency also helps reps write better outreach. Instead of generic messaging, they can reference the specific signals that made an account a good fit: “I noticed you recently hired a RevOps lead and are scaling your SDR team. Companies in similar situations have used Clay to...”
Territories stay balanced as markets shift
Markets don’t stand still, which is why Clay being dynamic and fluid helps our sales team. A sector that was cold in Q1 might be booming by Q3. Without continuous scoring, territories that looked fair in January become unbalanced by June.
Our quarterly rebalancing catches market shifts automatically. If SaaS companies suddenly become much stronger fits (maybe because we shipped a key integration), territories with higher SaaS concentration get flagged for review. Sales leadership can rebalance before one territory gets unfairly advantaged.
Common mistakes and how to avoid them
Based on our experience and conversations with other teams building similar systems, watch out for these issues:
Making initial scoring too complicated
Teams often try to build comprehensive scoring that accounts for every possible signal. This leads to analysis paralysis and delayed launches.
Start simple. Pick 5-7 signals you’re confident actually matter and build scoring around those. You can always add complexity later based on data about which scores actually predict closed deals.
Ignoring hierarchy relationships
Failing to map parent-child company relationships creates territory conflicts that waste sales time. Two reps arguing about who owns an account isn’t productive. Invest the time upfront to build proper hierarchy mapping in Clay. It prevents problems before they start.
Setting fit thresholds too high or too low
If your minimum fit threshold is too high (requiring 80+ scores for territory assignment), you artificially limit your addressable market and leave potentially good accounts unassigned.
If it’s too low (accepting 40+ scores), you water down territory quality and reps waste time on poor-fit accounts.
Start at 65 and adjust based on results. If reps consistently close deals with accounts scoring 55-65, lower your threshold. If accounts below 70 rarely convert, raise it.
Not updating scoring based on actual results
Your initial scoring weights are guesses. Some signals will prove more predictive than you expected, others less.
Every quarter, analyze which scored accounts actually closed deals. Did high-fit scores predict success? Were engagement scores accurate indicators of near-term conversion? Adjust your weights based on this data.
Forgetting to explain scoring to reps
If reps don’t understand how scoring works, they won’t trust it and won’t use engagement signals to prioritize their work.
Document your scoring methodology clearly. Show reps which signals matter and why. When scores change, explain what drove the change. This transparency builds trust and adoption.
Territory planning as a competitive advantage
Most sales teams still rely on static, once-a-year territory planning built on basic firmographic filters. They assign accounts in January and hope the market doesn’t shift too much.
But it always does — and that creates three big problems: territories go stale almost immediately, reps waste time on cold accounts because they lack engagement signals, and sales leaders can’t react quickly when new opportunities appear.
Clay solves all three issues with continuous scoring, automatic segmentation, and transparent signals. Territories stay balanced as conditions change. Reps focus on hot accounts instead of guessing. Sales leadership can reallocate attention and resources the moment new segments emerge.
Teams that adopt dynamic territory planning consistently outperform those stuck in annual assignments. It’s not magic — it’s better, fresher data about fit and engagement, and a system that updates itself as the market moves.
Sharp breakdown of transparent, multi-signal scoring. That same approach - clear weights, dynamic updates, actionable outputs applies directly to customer credit assessment and payment-term decisions in B2B finance. TCLM digs into how finance teams build scoring that both manages risk and enables growth. Might be worth a look.
(It’s free)- https://tradecredit.substack.com/
Thanks for sharing Clay! I have seen a good account methodology scoring system can create a 2x increase in conversion rates.