
How Clay automates deck creation


Customer success and sales teams spend hours building decks for every client interaction. Quarterly business reviews, executive briefings, renewal presentations, onboarding guides, each one means pulling data from multiple systems, building slides from scratch, and hoping you caught all the relevant context.
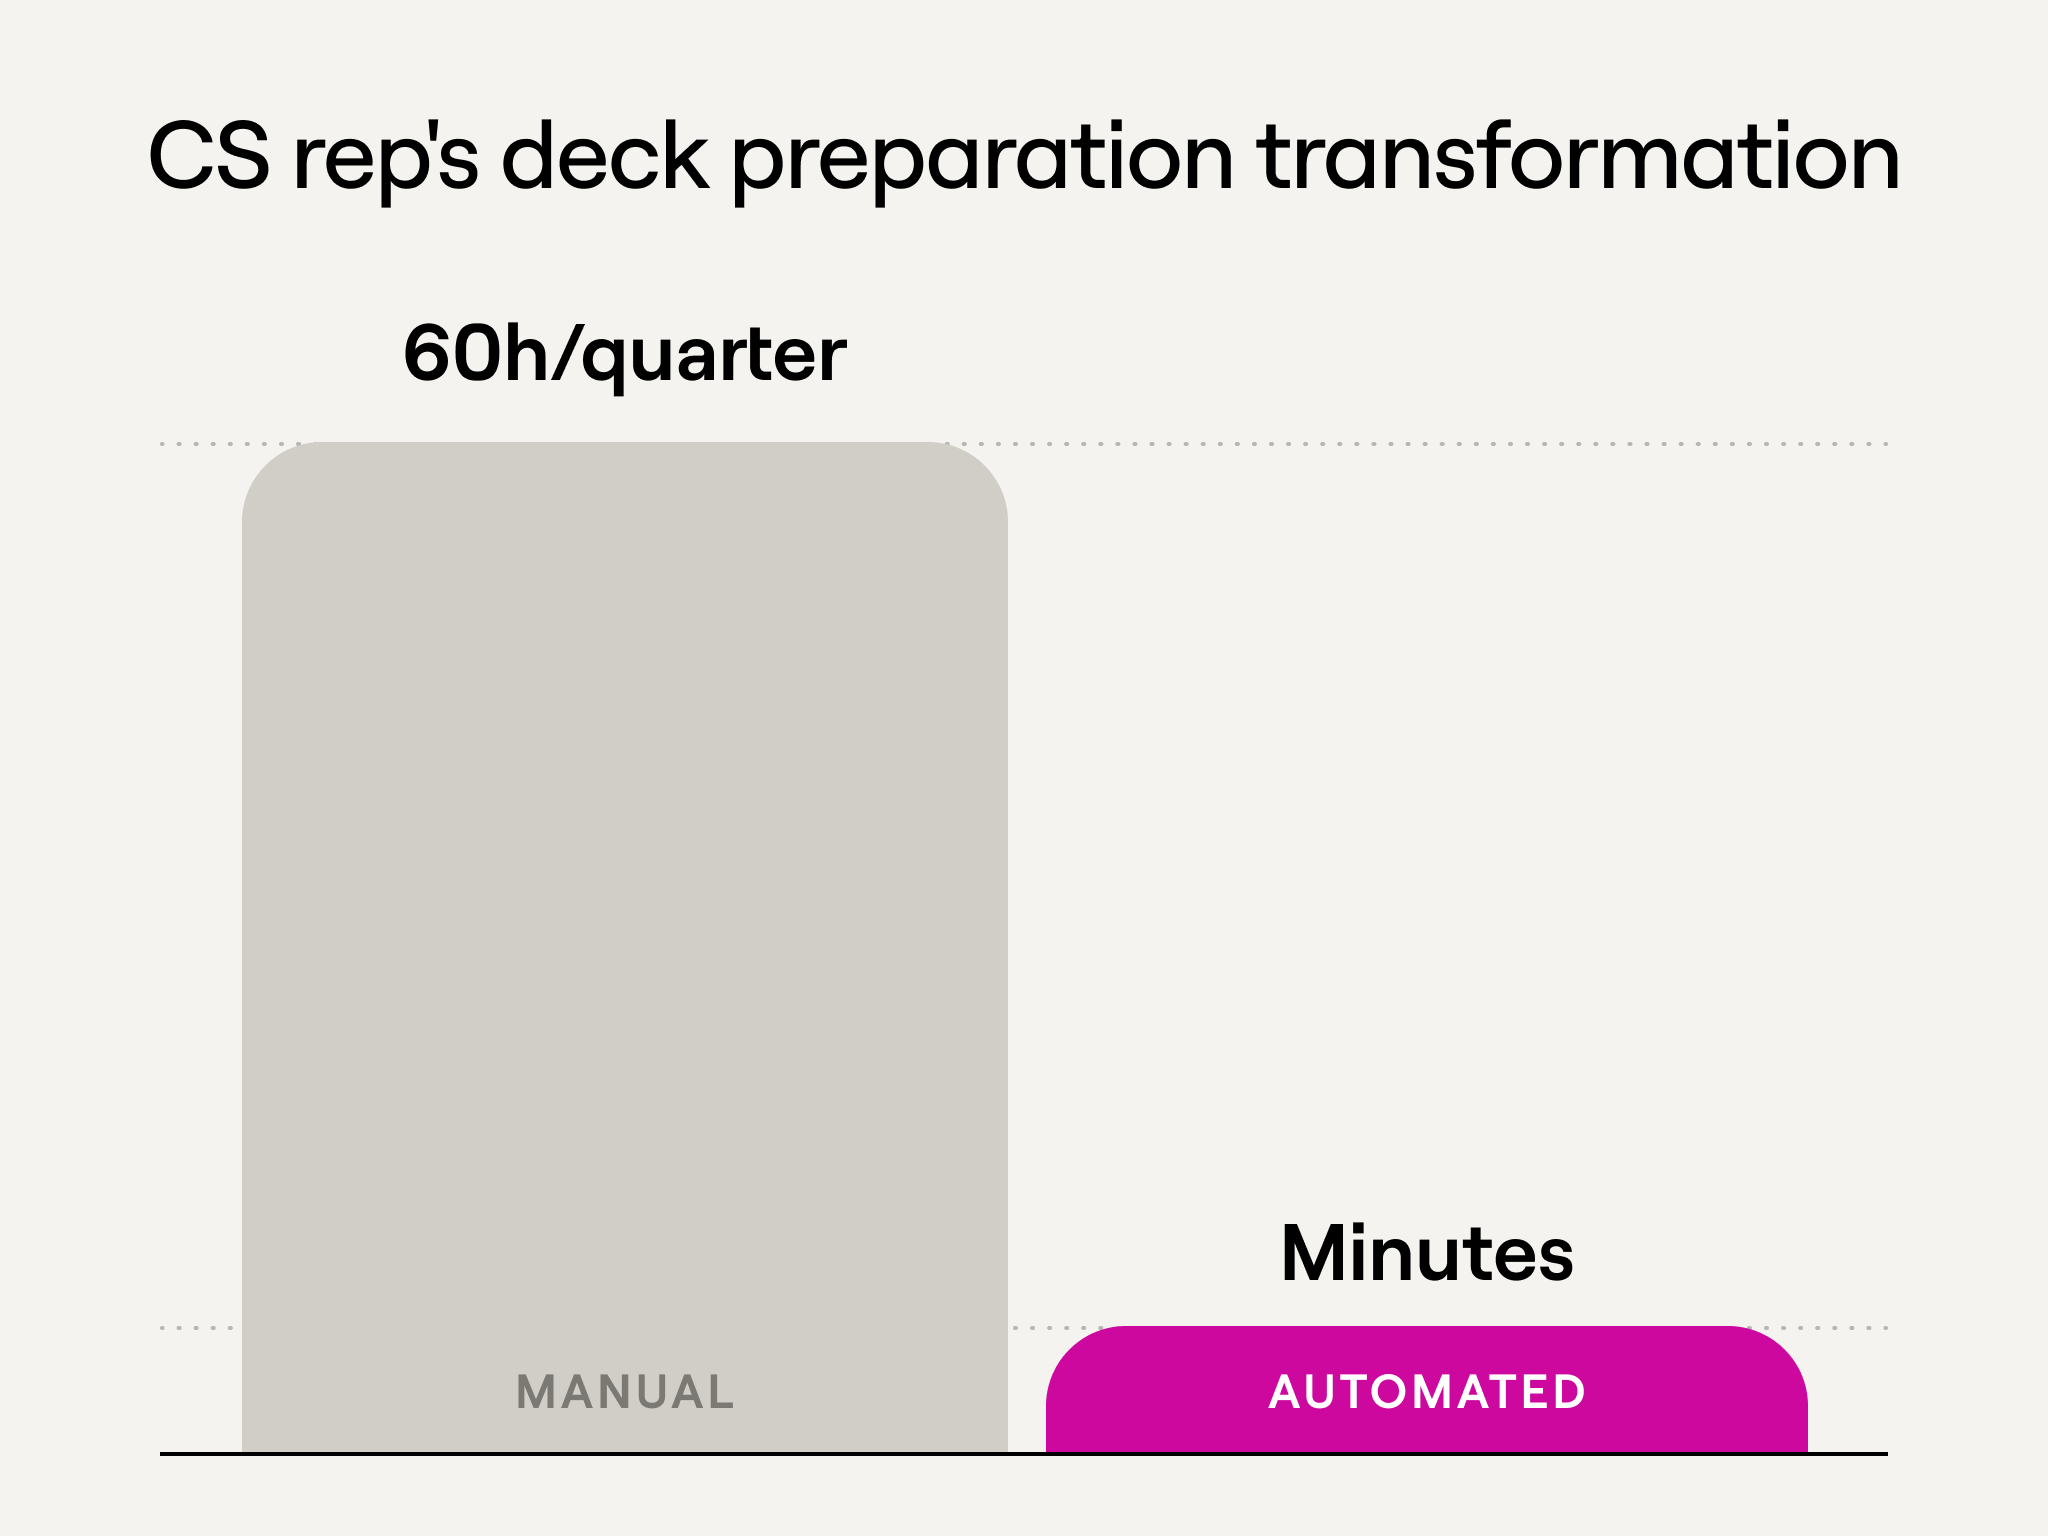
The manual work is expensive. A CS rep managing 15 accounts spends 90+ hours per quarter just on deck creation. That’s more than two full work weeks not spent talking to customers, identifying expansion opportunities, or preventing churn.
At Clay, we’ve built automated deck generation that pulls from product databases, CRM systems, and conversation intelligence to create complete presentations in minutes instead of hours. Our CS team went from 6 hours per QBR to 10 minutes of review time. Our sales team generates personalized pitch decks without touching design tools.
The system works because it solves the two hardest problems in deck creation: aggregating scattered data and transforming that data into compelling narrative content. Here’s how we built it and how your team can do the same.
Want to build this yourself? Watch our workshop where Clay GTME Bruno Radice walks through the complete implementation. You'll learn how to connect data sources, process customer intelligence, and generate finished presentations automatically.
The problem: Deck creation consumes time that should go to customers
Every go-to-market team faces the same challenges.
Data lives in too many places
Building a thorough customer deck means pulling information from product analytics, CRM systems, conversation intelligence, support tickets, and marketing automation. No single person has access to all these systems. Even when they do, extracting the right data takes hours of querying, exporting, and manual compilation.
Template-based approaches don’t scale
Most teams use slide templates that members fill in manually. This creates inconsistent quality—templates work well when people have time to use them properly, but under deadline pressure, slides get filled with generic content. Templates provide structure but not storytelling. Each slide addresses its section, but the deck doesn’t flow. Customer data changes constantly, and keeping decks current means rebuilding them from scratch each quarter.
Prioritization based on account size, not need
When deck creation takes 6 hours per account, teams prioritize. Enterprise customers get thorough QBRs with custom analysis. Mid-market accounts get lighter treatment. Small customers often don’t get formal reviews at all. Sometimes your smallest customers have the highest expansion potential, but manual deck creation forces you to choose who gets attention based on current ACV rather than actual opportunity.
Use case 1: Automated QBRs that feel like strategic partnership reviews
Before automation, our CS team spent 6 hours per quarterly review, including 45 minutes pulling product usage data from Snowflake, 30 minutes reviewing CRM records, 60 minutes analyzing Gong transcripts, 90 minutes building the narrative, 2 hours just creating slides, and 30 minutes reviewing.
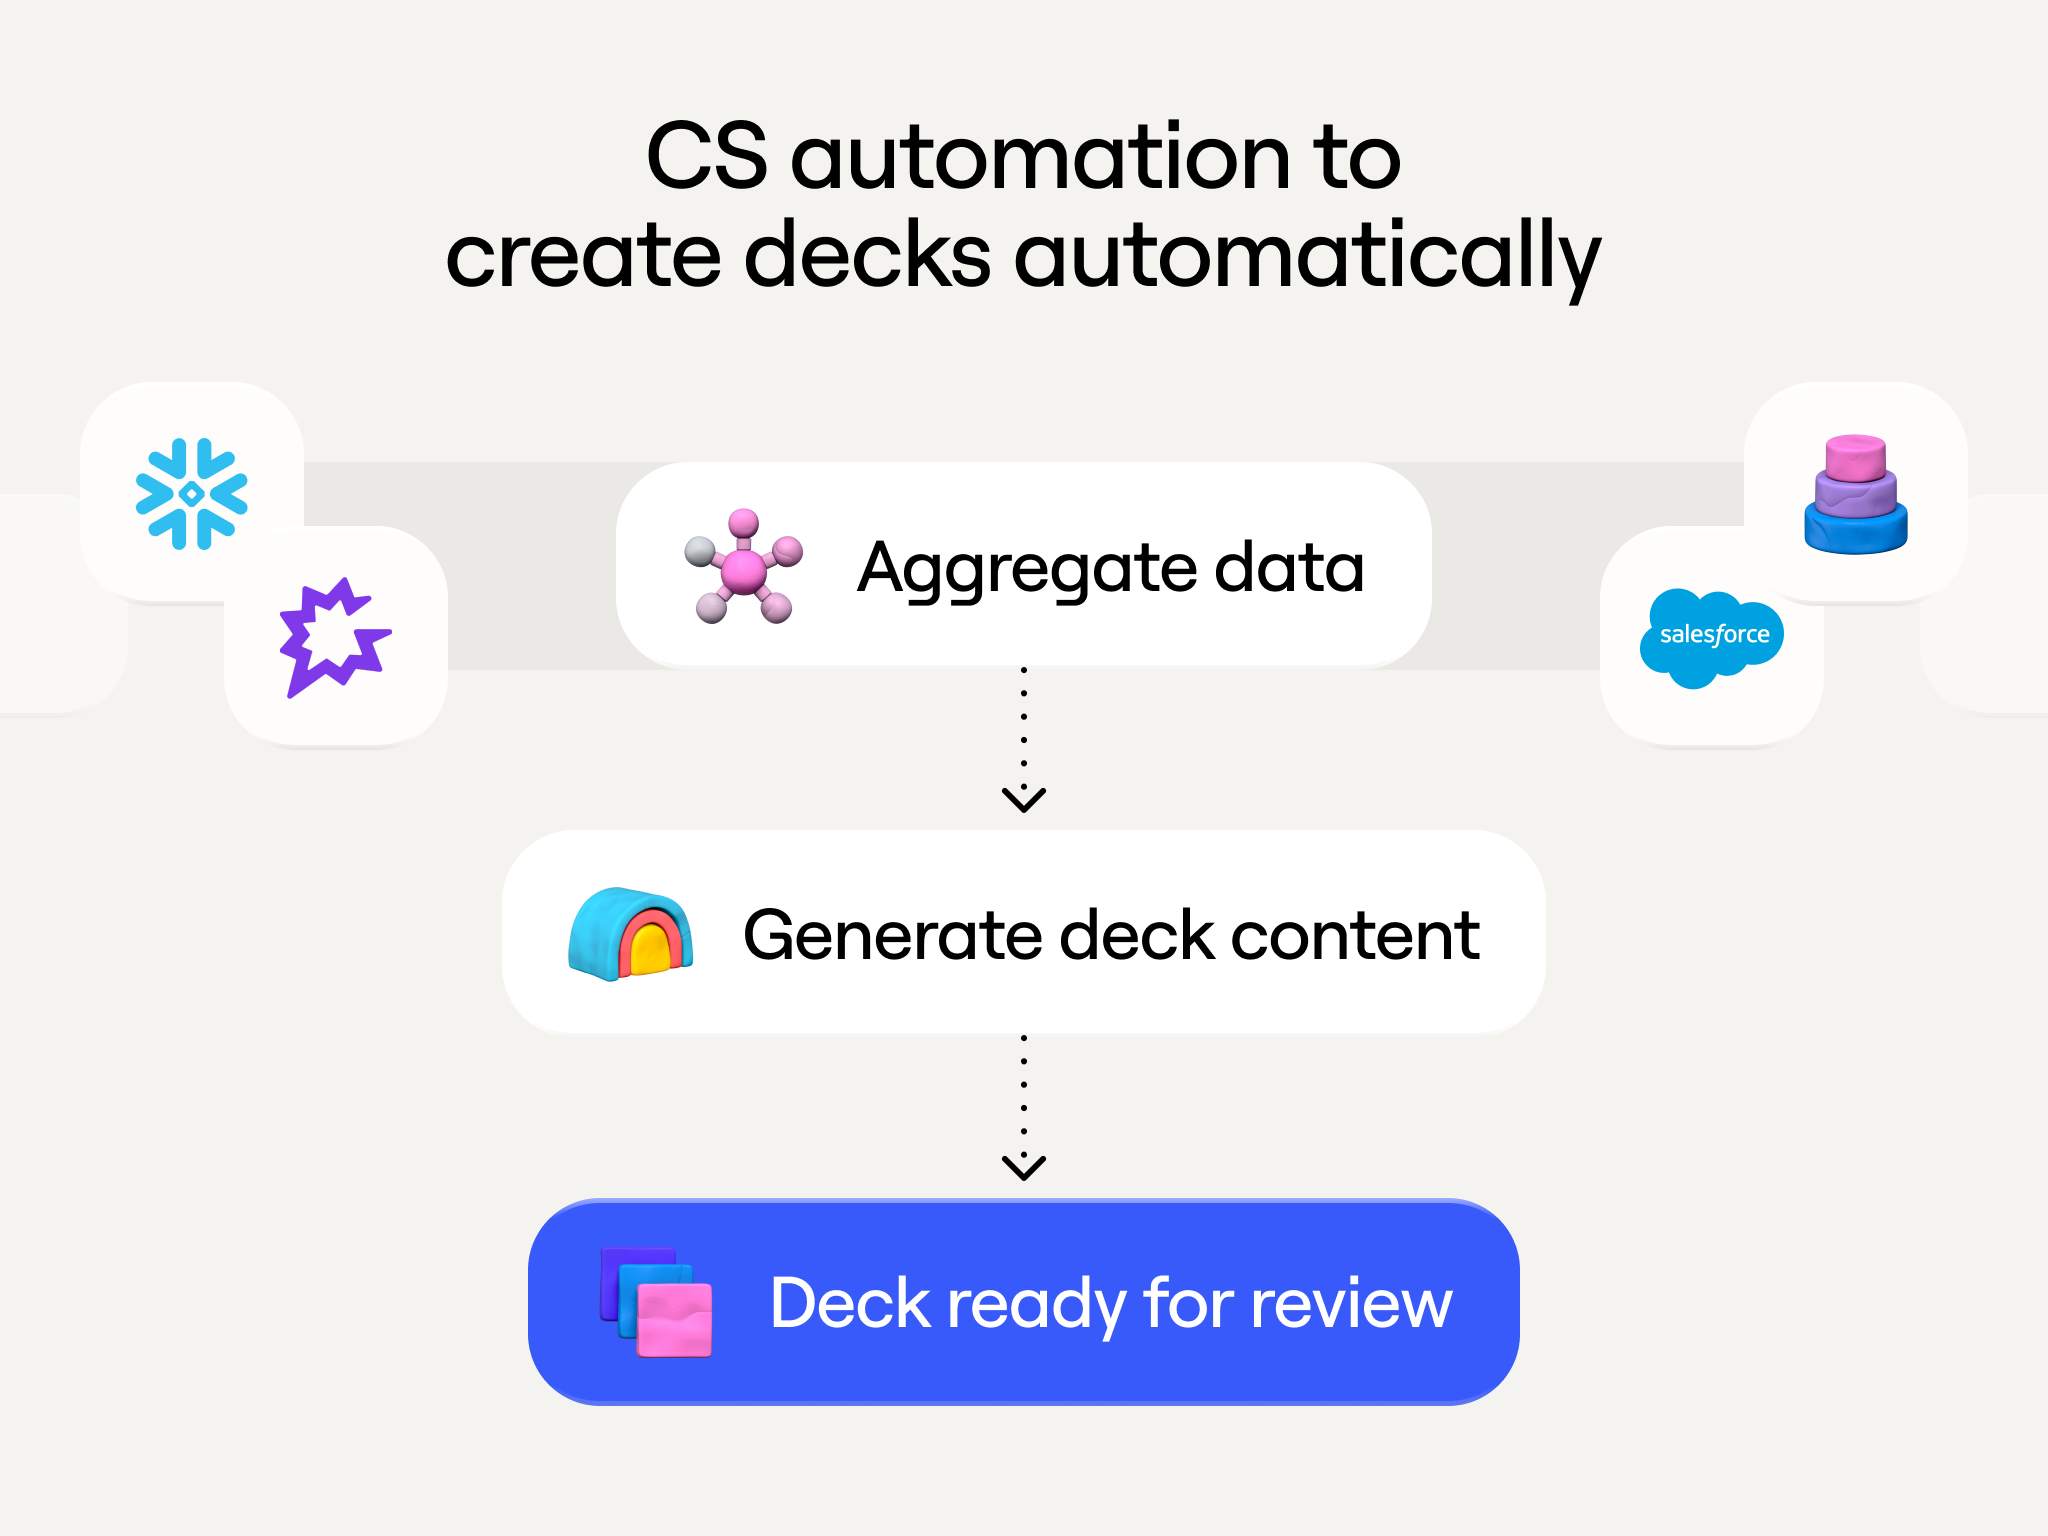
Now a CS rep types /generate_qbr [account_name] in Slack. Clay queries Snowflake for product usage, pulls CRM context from Salesforce, processes conversation transcripts from Gong, generates narrative content using AI, and populates a slide template with data, charts, and text. The rep receives a 90% complete deck in about 10 minutes.
What the automated QBR includes
Our standard template contains: customer logo and branding, executive summary with 3-4 key accomplishments, enrichment and activity overview showing total accounts/contacts enriched and workflow execution volume, implemented use cases with business outcomes and conversation quotes, retrospective on joint initiatives like hackathons or training, forward-looking roadmap of discussed-but-not-implemented use cases, credit pacing with expansion recommendations, and source citations for every data point.
Impact on renewal conversations
Renewal calls can now start with comprehensive context. The CS rep walks through concrete achievements: “You enriched 47,000 contacts this quarter using Clay’s waterfall system. Your sales team spent 60% less time on manual research. You built three new workflows that your SDRs use daily.”
The conversation shifts from justifying cost to planning expansion. When the deck shows the customer discussed implementing ABM workflows but hasn’t started yet, that becomes a natural talking point. More importantly, smaller accounts get the same quality QBRs as enterprise customers because deck creation isn’t a time constraint anymore.
Use case 2: Personalized sales decks generated from prospect research
Sales teams need personalized pitch presentations for every prospect, but building custom decks doesn’t scale when you’re running 20+ demos per week.
When a demo gets scheduled, Clay’s enrichment pipeline runs automatically, pulling firmographic data, technographic signals, recent news, and hiring patterns. Claygent analyzes the prospect’s website and LinkedIn to understand their business model and go-to-market approach. Based on this enrichment, the system identifies which Clay use cases are most relevant and generates a customized pitch deck with the prospect’s logo and branding, industry-specific examples, relevant use cases with ROI estimates, integration callouts for tools they currently use, and competitive positioning if they’re evaluating alternatives.
Use case 3: Executive briefings for account planning
Account executives managing strategic accounts need executive briefing decks for internal planning sessions. Creating these traditionally takes 4+ hours: stakeholder mapping, competitive intelligence, product usage analysis, strategic opportunity identification, and deck creation.
We automated this so account teams always have current intelligence. The workflow runs on a schedule for strategic accounts: Clay monitors LinkedIn for stakeholder changes, tracks competitor mentions in conversation transcripts, queries product database for usage trends, uses AI to identify patterns suggesting expansion or churn risk, and generates a comprehensive deck with stakeholder maps, competitive positioning, usage analysis, and strategic recommendations.
What makes automated briefings effective
The key is connecting data that normally stays siloed. When a champion changes roles, the briefing highlights this and flags conversations where other potential champions were identified. If an account increases usage of specific features and posts jobs for roles that would use those features, the briefing flags this as an expansion signal. When competitors get mentioned as renewal approaches, the briefing creates a competitive defense strategy section with relevant case studies.
How to build automated deck generation
Step 1: Map your data sources
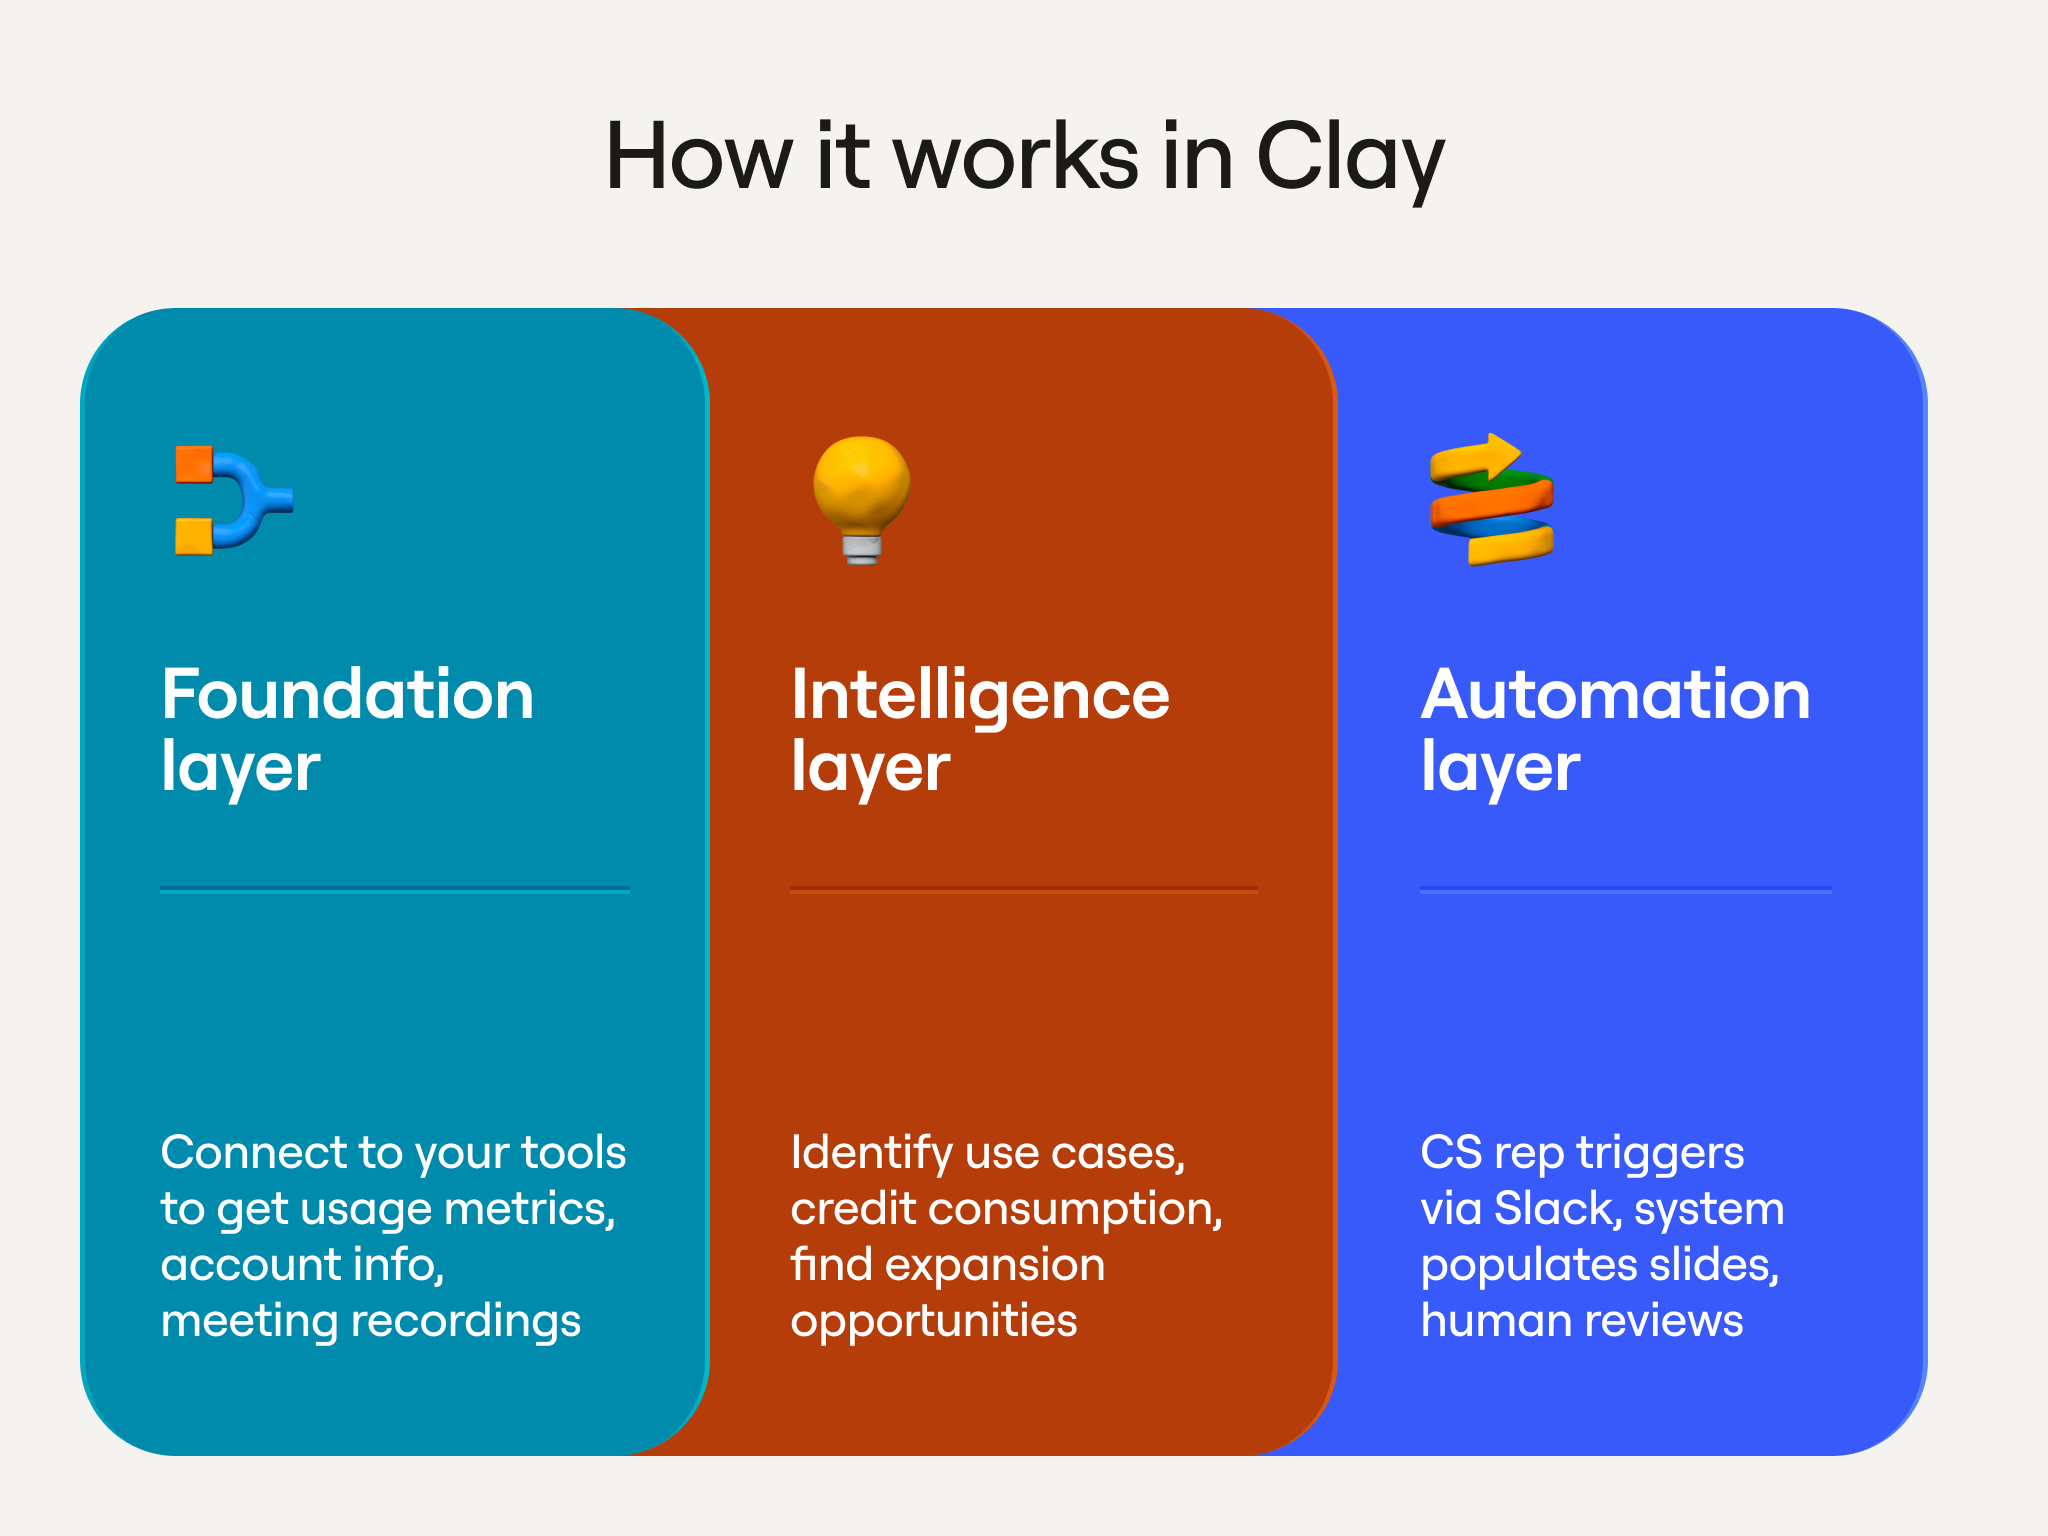
Start by identifying where deck information lives. For product usage data, set up API access to your data warehouse (Snowflake, BigQuery, Redshift). Define queries that pull account-level metrics, user-level activity, and workflow patterns. Connect your CRM using native integrations to access account information, contact data, opportunity context, and historical notes. Connect conversation intelligence platforms to extract implemented use cases, feature requests, pain points, and expansion signals.
Start with these three core sources (product data, CRM, conversation intelligence) and add others like support tickets or marketing automation as you refine the system.
Step 2: Define your deck templates
Use Google Slides to build content-focused templates that define slide types and content placeholders.
Here’s our QBR template structure:
Slide 1 - Cover
- Customer logo (image slot)
- "Q[X] [YEAR] Business Review" (title)
- Date range (text field)
- CS rep name and contact (text field)

Slide 2 - Executive Summary
- "Key Achievements This Quarter" (title)
- 3-4 bullet points (text fields with data placeholders)
- High-level metric callout (large number with context)

Slide 3 - Enrichment Overview
- "Accounts and Contacts Enriched" (title)
- Total enrichment volume (number + chart showing trend)
- Enrichment breakdown by data provider (bar chart)
- Credit consumption (number + percentage of allocation)

Slide 4-6 - Use Cases (one slide per active use case)
- Use case name (title)
- Business outcome achieved (text with supporting metric)
- Specific example from conversation transcript (quoted text with citation)
- Product features utilized (bullet list)

Slide 7 - Joint Initiatives
- "What We Built Together" (title)
- Hackathons attended (text list)
- Custom implementations (text list with links)
- Training sessions completed (text list)

Slide 8 - Opportunity Pipeline
- "Use Cases We've Discussed" (title)
- Use cases mentioned but not implemented (bullet list)
- Requirements for each (nested bullets)
- Expected business impact (text or metrics)

Slide 9 - Credit Pacing
- Current consumption rate (number + chart showing trend)
- Projected usage through renewal (number with confidence interval)
- Expansion recommendation (text with calculation shown)

Slide 10 - Next Steps
- Action items for customer (bullet list)
- Action items for CS team (bullet list)
- Next meeting scheduled (date field)
Each slide type includes clear data placeholders so the automation knows exactly which data goes where. In order to format this in Google Slides,so the data gets routed to the right place you want to use this format:
{{datapoint we are mapping}}
By structuring things in {{x}} will tell the system to send the point there
For images, you’ll want to make the text box as big as you want the picture to be and follow the same format as {{image}} within that textbox.
Step 3: Build data extraction and processing
Query your product database for account-specific metrics. For QBRs, we query Snowflake for enrichment activity, workflow execution, table creation, and feature adoption:
SQL
-- Enrichment activity
SELECT
  COUNT(DISTINCT account_id) as accounts_enriched,
  COUNT(DISTINCT contact_id) as contacts_enriched,
  SUM(credits_consumed) as total_credits,
  provider_name,
  success_rate
FROM enrichment_events
WHERE account_id = '[ACCOUNT_ID]'
  AND event_timestamp >= '[QUARTER_START]'
  AND event_timestamp <= '[QUARTER_END]'
GROUP BY provider_name

-- Workflow execution
SELECT
  workflow_name,
  COUNT(*) as execution_count,
  AVG(duration_seconds) as avg_duration,
  success_rate
FROM workflow_runs
WHERE account_id = '[ACCOUNT_ID]'
  AND run_timestamp >= '[QUARTER_START]'
  AND run_timestamp <= '[QUARTER_END]'
GROUP BY workflow_name
Process conversation transcripts through Claude to extract structured insights:
Use cases implemented:
{
  "use_case": "Automated outbound prospecting",
  "status": "fully_implemented",
  "implementation_date": "2024-08-15",
  "business_outcome": "SDR team reduced list-building time by 70%",
  "supporting_quote": "We've completely eliminated manual prospecting. Our SDRs now spend their time actually talking to prospects instead of building lists.",
  "quote_speaker": "Sarah Chen, VP Sales",
  "conversation_date": "2024-09-22"
}
Feature requests and pain points:
{

  “request_type”: “integration”,

  “description”: “Native Marketo integration for European compliance workflows”,

  “business_justification”: “Current workaround requires manual CSV exports which creates GDPR risk”,

  “priority_signal”: “mentioned in 3 separate conversations”,

  “quote”: “If we had direct Marketo integration, we could automate our entire European campaign workflow.”,

  “quote_speaker”: “Thomas Schmidt, Marketing Operations”,

  “conversation_date”: “2024-10-05”

}
Expansion signals:
{

  “signal_type”: “adjacent_use_case”,

  “description”: “Interest in ABM workflows for enterprise segment”,

  “current_usage”: “Only using Clay for prospecting currently”,

  “expansion_potential”: “Would expand to marketing team (8 additional users)”,

  “quote”: “Our marketing team keeps asking if Clay can help with our ABM campaigns. That’s not what we bought it for, but it seems like it could.”,

  “quote_speaker”: “Rachel Martinez, Director of Revenue Operations”,

  “conversation_date”: “2024-09-29”

}
These structured extractions get stored in Clay tables and become source material for deck generation.
Pull account and contact information from your CRM:
Account Context:

- Company name: [from Salesforce Account.Name]

- Industry: [from Account.Industry]

- Employee count: [from Account.NumberOfEmployees]

- Current contract value: [from Account.Annual_Contract_Value__c]

- Contract start: [from Account.Contract_Start_Date__c]

- Renewal date: [from Account.Renewal_Date__c]

Primary Stakeholders:

- Decision maker: [from Contact where Role = ‘Decision Maker’]

- Champion: [from Contact where Role = ‘Champion’]

- Primary user: [from Contact where Role = ‘Primary User’]

- Executive sponsor: [from Contact where Role = ‘Executive Sponsor’]

Use Cases (from sales):

- [from Opportunity.Use_Cases__c for closed won opportunity]
Step 4: Build narrative generation
Use Claude to transform structured data into deck content. Provide clear prompts with context, data, specific instructions, tone guidance, and examples.
Example prompt for executive summary generation:
You are writing the executive summary for a quarterly business review deck.

CONTEXT:

Account: [Company Name]

Quarter: Q3 2024

Primary Use Cases: [List from CRM]

Key Stakeholders: [Names and roles]

PRODUCT USAGE DATA:

- Accounts enriched: [number]

- Contacts enriched: [number]

- Workflows created: [number]

- Active users: [number]

- Credit consumption: [number] credits ([percentage]% of allocation)

CONVERSATION INSIGHTS:

[Paste relevant use case implementations and outcomes extracted from transcripts]

TASK:

Write 3-4 bullet points for the executive summary slide that highlight this quarter’s key achievements. Each bullet should:

- Lead with the business outcome, not the feature

- Include a specific metric

- Connect product usage to business value

- Use active voice and clear language

TONE:

- Professional but not stuffy

- Focused on partnership and collaboration

- Confident in value delivered

- Forward-looking (what this enables, not just what was accomplished)

EXAMPLE OUTPUT:

• Accelerated sales team efficiency by 70%—your SDRs now spend 40+ hours less per month on manual research, redirecting that time to prospect conversations. You enriched 47,000 contacts this quarter using Clay’s waterfall system.

• Expanded your outbound motion into two new verticals—you built targeted prospecting workflows for healthcare and financial services segments, generating 230 qualified meetings in markets you previously couldn’t reach effectively.

• Scaled your data operations without scaling your team—despite 3x growth in account volume, your RevOps team maintained the same headcount by automating enrichment, routing, and data hygiene workflows.

Create similar prompts for each slide type. You can use a Use case slides get narrative explaining the workflow and outcome achieved. Opportunity pipeline slides explain what each discussed use case would enable. Forward-looking slides analyze usage patterns to identify optimization opportunities and generate actionable recommendations.
Step 5: Automate slide population
We built this as modular Clay workflows:
Workflow 1: Data aggregation
Trigger: Slack command /generate_qbr [account_name] or scheduled run
Query Snowflake for product usage metrics
Pull CRM data from Salesforce
Retrieve processed conversation insights from Clay tables
Store all aggregated data in a Clay table row
Workflow 2: Content generation
Read aggregated data from workflow 1
Generate narrative content for each slide using Claude
Store generated content back in Clay table
Workflow 3: Deck assembly
Create new Google Slides presentation from template
For each slide, insert content from workflow 2
Add charts using Google Sheets (generated from data) embedded in slides
Insert source citations
Save and share presentation
Workflow 4: Delivery
Send Slack message to CS rep with link to generated deck
Include summary of key metrics pulled
Note any data quality issues or missing information
Set reminder to review deck before customer meeting
This modular approach makes debugging easier and lets you improve individual steps without rebuilding the entire system.
Handle edge cases
If critical fields are empty, flag it: “No conversation transcripts found for Q3 - use case slides may be less detailed than usual.” If product usage data shows high activity but conversations don’t mention it, flag the conflict. If numbers seem unusual, flag for verification: “Credit consumption jumped 400% this quarter - verify this is accurate before presenting to customer.” Always include source citations: “[Source: Snowflake query run 2024-01-15, Salesforce Account record updated 2024-01-14]”
Step 6: Build the review process
Automated generation creates 90% complete decks. The final 10% requires human review. Create a review checklist: verify data accuracy (do metrics match your understanding?), ensure narrative coherence (does the deck tell a compelling story?), identify customization opportunities (are there specific examples you can add?), and check tone and voice (does the language match your relationship with this customer?). Review should take 10-15 minutes for a standard deck.
Make refinement easy with inline editing in Google Slides, a content library of pre-approved examples, template variations for different layouts, and reusable customizations that apply to future decks for the same customer.
What you need to build this
Required: Clay account, pProduct usage database (Snowflake, BigQuery, Redshift), CRM with solid data hygiene (Salesforce, HubSpot), presentation software with API access (Google Slides or PowerPoint), and at least one well-defined deck template.
Highly recommended: Conversation intelligence platform (Gong, Chorus, Fireflies), Slack for triggering and delivery, and structured approach to capturing use cases in your CRM.
Team roles: GTM Engineer or RevOps builds and maintains workflows, Sales/CS Operations defines requirements and provides feedback, and Sales/CS team members test and champion adoption. One GTM engineer can build the initial system in 2-3 weeks. Ongoing maintenance is a few hours per month.
Implementation roadmap
Phase 1: Single deck type, manual triggers
Pick your highest-value deck type, connect three core data sources, create a template with 5-7 key slides, build the workflow to generate decks on-demand, and have 2-3 team members test it. Success means generated decks are 80%+ accurate, review takes under 20 minutes, and the team prefers automated decks to building manually.
Common pitfalls: trying to include everything in your first template, over-engineering the review process, and perfectionism on content generation. Start with the content that matters most and improve prompts based on feedback.
Phase 2: Expand to related deck types
Add 2-3 more deck types using similar data sources, create templates for each, build tailored content generation prompts, and set up automated triggers where appropriate. If you started with QBRs, natural expansions are executive briefings, renewal presentations, and expansion pitch decks. Success means multiple deck types generating successfully with consistent review time.
Phase 3: Automate triggers and scheduling
Build automated triggers based on calendar events or CRM updates, scheduled generation (QBRs auto-generate 3 days before review meetings), proactive notifications when decks are ready, and error handling. We auto-generate QBR decks 3 days before scheduled meetings, pitch decks when opportunities reach “Demo Scheduled” stage, executive briefings weekly for strategic accounts, and onboarding decks when deals close.
Phase 4: Optimization and expansion
Build analytics on deck generation, create feedback loops to improve prompts, connect additional data sources as value becomes clear, and add team-specific customizations. Review generated decks monthly to identify systematic issues, track which data points are missing most often, get feedback on slide layouts, and look for other repetitive deck creation tasks that fit the same pattern.
Common mistakes and how to avoid them
Starting with too many deck types: Build one deck type well, get adoption, then expand. Each deck type benefits from infrastructure built for previous ones.
Under-investing in data quality: Automated decks are only as good as underlying data. Audit core data sources and implement hygiene processes before building automation.
Over-relying on templates: Build flexible templates with optional sections. If a customer didn’t attend hackathons, skip that slide rather than showing empty sections.
Insufficient review process: Always build in human review. Generated content should be 90% accurate, but that final 10% makes the difference.
Not measuring time savings: Track deck creation time before and after automation. If review time creeps up, improve your content generation.
Ignoring team feedback: Create regular feedback loops. Review decks with users monthly and prioritize improvements.
The business case
Direct time savings: Our CS team spent 6 hours per QBR × 50 QBRs per quarter × $150/hour = $45,000 per quarter in labor costs. Automation reduces this to 15 minutes review × 50 decks × $150/hour = $1,875 per quarter. Quarterly savings: $43,125. The system pays for itself in the first quarter.
Opportunity cost: Those 6 hours per account get reallocated to customer conversations, proactive outreach, implementation support, and strategic planning. If automation lets each CS rep handle 20% more accounts without quality degradation, you can scale revenue without scaling headcount.
Consistency and quality: Manual deck quality varies by who creates it and how much time they have. Automation raises the floor—every customer gets thorough treatment regardless of who their CS rep is or how busy the team is.
Faster response time: Manual deck creation takes days. Automated generation means same-day turnaround, which improves customer perception and speeds up decision-making cycles.
For a 50-person CS team: 200+ hours saved per quarter, ~$175K per year in cost savings, ~$40K implementation cost, $135K net savings year one, and $175K ongoing annual savings. The system pays for itself in under 3 months and delivers 4.4x ROI in year one.